SaaS Metrics Explained: MRR, ARR, Churn, NRR, LTV:CAC, Payback and the Rule of 40
A complete, plain-English guide to the recurring-revenue metrics that decide whether a SaaS business is healthy, with the formulas, the benchmarks, and the traps to avoid.
By Mubasher Hussain · Published 2026-09-21 · Updated 2026-09-01 · 3249 words · about 14 minute read
A software-as-a-service business runs on recurring revenue, and that changes everything about how you measure it. A traditional company that sells a product once can read its health from a single income statement. A SaaS company sells the same subscription over and over, month after month, so its health lives not in one number but in the movement of a handful of connected metrics: how much recurring revenue it earns, how fast that revenue grows, how much of it leaks away through cancellations, how much each customer is worth over their lifetime, and how much it costs to win them in the first place. Understanding these metrics, and how they fit together, is the difference between running a subscription business on instinct and running it on evidence.
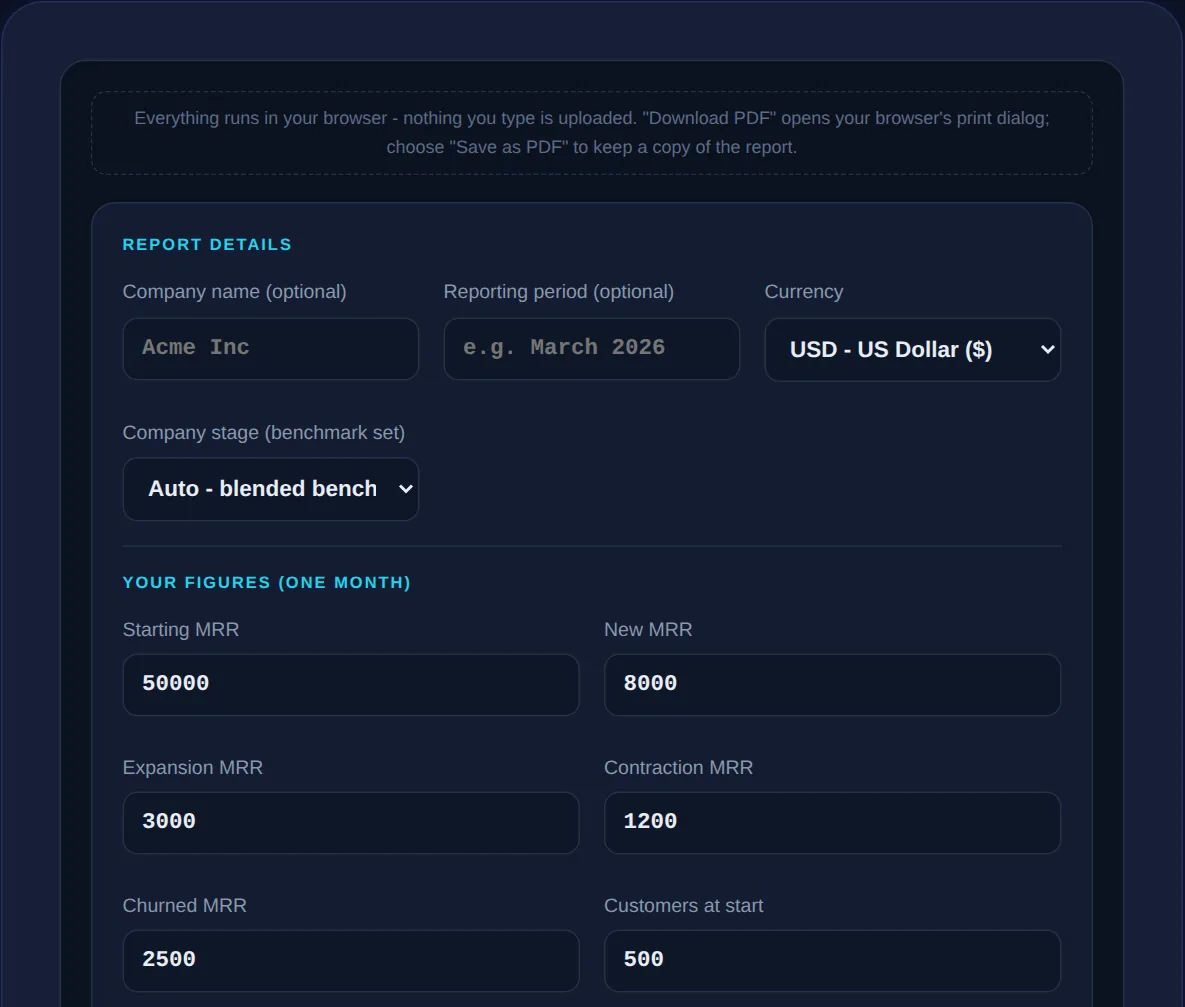
This guide walks through every core SaaS metric in plain language: what it means, how it is calculated, what a healthy value looks like, and how it connects to the others. It is written for founders, operators and anyone who needs to read a SaaS profit-and-loss picture without a finance degree. If you want to see these numbers computed from your own figures as you read, the free SaaS Metrics Analyzer turns one month of revenue and customer movement into a full report, with every formula and benchmark shown alongside the result. Nothing in this article is financial or investment advice; it is an explanation of how the metrics work.
The building block: MRR and ARR
Monthly recurring revenue, almost always shortened to MRR, is the normalised amount of subscription revenue a business earns in a month. The word normalised matters: if a customer pays 1,200 dollars for an annual plan, you do not count 1,200 dollars of MRR in the month they pay. You spread it evenly, counting 100 dollars of MRR in each of the twelve months the plan covers. MRR is deliberately blind to the timing of payments because its job is to show the steady, repeatable revenue the business can rely on, not the lumpy cash that happens to land in a given month. That steadiness is exactly what makes recurring-revenue businesses valuable and predictable.
Annual recurring revenue, or ARR, is simply MRR multiplied by twelve. It is the same underlying number expressed on a yearly basis, and it is the figure most often quoted when people describe the size of a SaaS company. ARR is a run-rate, not a record of the past: an ARR of 1.2 million dollars means that if the business froze exactly where it is today and kept every current subscription for a year, it would collect 1.2 million dollars. Because ARR is derived directly from MRR, everything that moves MRR moves ARR in lockstep, which is why the rest of this guide focuses on the monthly figure.
The four movements of MRR
MRR is never static. Every month it is pushed up and pulled down by four distinct forces, and separating them is the single most illuminating thing you can do with your revenue data. New MRR is recurring revenue from brand-new customers. Expansion MRR is additional recurring revenue from existing customers who upgrade, add seats or buy more. Contraction MRR is recurring revenue lost when existing customers downgrade but stay. Churned MRR is recurring revenue lost when customers cancel outright. Your ending MRR is simply the starting MRR plus new and expansion, minus contraction and churn.
| MRR movement | What it is | Effect on MRR |
|---|---|---|
| Starting MRR | The recurring revenue you began the month with | Baseline |
| New MRR | Revenue from customers acquired this month | Increases |
| Expansion MRR | Upgrades, extra seats and add-ons from existing customers | Increases |
| Contraction MRR | Downgrades from customers who stay | Decreases |
| Churned MRR | Revenue lost from customers who cancel | Decreases |
| Ending MRR | Start + New + Expansion - Contraction - Churn | Result |
The figure that ties these together is net new MRR: new plus expansion, minus contraction and churn. Net new MRR is arguably the truest single measure of a month, because it captures the whole story in one number. Two companies can add identical amounts of new revenue, yet one is thriving and the other is treading water, and the difference is entirely in what they lost to contraction and churn. A business can even post strong new sales and still shrink, if its existing base is leaking faster than the sales team can refill it. Net new MRR is what tells you which of those is happening.
A booking is a signed contract, a billing is an invoice sent, and recurring revenue is the value recognised over time. A customer who signs a 12,000 dollar annual deal is a 12,000 dollar booking, may be a 12,000 dollar billing today, but adds only 1,000 dollars of MRR. Mixing these three up is one of the most common ways SaaS numbers get misreported, so it is worth being precise about which one you mean.
MRR growth rate
Your MRR growth rate is net new MRR divided by starting MRR, expressed as a percentage. It answers a simple question: by what proportion did your recurring revenue grow this month under its own steam? A month that starts at 50,000 dollars and adds 4,000 dollars of net new MRR grew at 8 percent. Growth rate matters more than the absolute dollar figure because it is comparable across time and across companies of different sizes, and because compounding at a steady monthly rate is what turns a small SaaS business into a large one. Small differences in growth rate, sustained over a year or two, produce enormous differences in outcome, which is the same compounding force that governs compound interest.
Churn: the leak in the bucket
Churn is the rate at which you lose recurring revenue or customers, and it is the metric that quietly decides the ceiling on a SaaS business. Gross MRR churn is churned MRR divided by starting MRR, the raw monthly leak rate of your recurring revenue. If you start a month with 50,000 dollars of MRR and lose 2,500 dollars of it to cancellations, your gross MRR churn is 5 percent. That may sound small, but churn compounds against you every single month, and a business losing 5 percent of its revenue monthly has to run hard just to stay level. For most established business-to-business SaaS companies, gross monthly MRR churn below about 3 percent is considered healthy, and best-in-class companies are lower still.
It is important to distinguish revenue churn from customer churn, also called logo churn. Logo churn is the number of customers who cancelled divided by the number you started with, and it counts heads rather than dollars. The two can diverge sharply. If the customers who leave are mostly small accounts, your logo churn can look alarming while your revenue churn stays modest, because the departing customers were not worth much. The reverse, a low logo churn but high revenue churn, is more dangerous, because it means you are losing your largest, most valuable accounts. Tracking both, and comparing them, tells you not just how many customers you are losing but which ones.
Retention: NRR and GRR
Retention is churn turned inside out, and it is where recurring-revenue businesses either compound or stall. Net revenue retention, or NRR, measures what happens to the revenue from your existing customers over a period, including their expansion. It is calculated as starting MRR plus expansion, minus contraction and churn, all divided by starting MRR, and it deliberately excludes any revenue from brand-new customers. NRR answers the pivotal question: if you stopped acquiring new customers entirely, would your existing base grow, hold or shrink? An NRR above 100 percent means your current customers are collectively spending more over time, through upgrades and add-ons, than you are losing to downgrades and cancellations. That is the compounding engine of elite SaaS: revenue that grows on its own without a single new logo.
Gross revenue retention, or GRR, is the more conservative cousin. It strips out expansion entirely and measures only how much of your starting revenue you kept: starting MRR minus contraction and churn, divided by starting MRR. Because it ignores upgrades, GRR can never exceed 100 percent, and it shows the pure durability of your revenue base. The gap between GRR and NRR is exactly the contribution of expansion. A company with 90 percent GRR and 115 percent NRR is losing 10 percent of its base but more than replacing it through upsell to the customers who remain, a very healthy profile.
| Retention metric | Formula | Healthy range |
|---|---|---|
| Gross MRR churn | Churned MRR / Start MRR | Under 3% per month |
| Gross revenue retention (GRR) | (Start - Contraction - Churn) / Start | 90% or higher |
| Net revenue retention (NRR) | (Start + Expansion - Contraction - Churn) / Start | 100% to 120%+ |
| Logo (customer) churn | Churned customers / Customers at start | Under 3% per month |
A business with NRR over 100 percent grows even if it never signs another customer, because its existing base expands faster than it churns. Investors prize this above almost any other metric, because it means growth is not wholly dependent on an ever-more-expensive acquisition engine. When you can only improve one number, closing the gap to 100 percent NRR is usually worth more than adding new logos on top of a leaking base.
Customer lifetime and LTV
If a customer has a constant monthly chance of cancelling, then their expected lifetime, the average number of months they stay, is simply one divided by that monthly churn rate. A 5 percent monthly churn implies an average lifetime of twenty months; a 2 percent churn implies fifty months. This relationship is why churn dominates everything downstream: halving your churn does not just reduce a leak, it doubles the expected lifetime of every customer, and therefore doubles the revenue each one will ever produce. Nothing else on this list has quite that leverage.
Customer lifetime value, or LTV, puts a figure on that lifetime. It is the average revenue per account multiplied by the gross margin (so that it reflects profit, not just top-line revenue) multiplied by the average lifetime in months. In other words, LTV is the total gross profit you can expect a customer to generate before they leave. Because lifetime is one divided by churn, LTV is exquisitely sensitive to churn: a small reduction in the monthly cancellation rate produces a large increase in LTV. This is the single most important thing to understand about SaaS economics, and it is why retention work so often produces a better return than acquisition spend.
CAC and the two ratios that judge it
Customer acquisition cost, or CAC, is the fully-loaded cost of winning one new customer: all of your sales and marketing spend over a period, divided by the number of customers that spend produced. Fully-loaded means everything, salaries and commissions, advertising, tools and overhead attributable to growth, not just the ad bill. CAC on its own says little; a high CAC is perfectly fine for a product that keeps customers for years and expands within them, and a low CAC is no comfort if those customers churn in a quarter. CAC only becomes meaningful when you weigh it against the value a customer returns, which is the job of the next two ratios.
The LTV to CAC ratio is lifetime value divided by acquisition cost, and it is the headline judgement on whether your growth is profitable. The widely used rule of thumb is that a ratio of 3 to 1 or higher is healthy: every dollar spent acquiring a customer returns at least three dollars of gross profit over that customer's life. A ratio below 1 to 1 means you lose money on every customer you acquire, and no amount of growth will fix that, growth simply loses money faster. Interestingly, a ratio that is very high, say 8 to 1, is not always the triumph it appears; it can be a sign that you are under-investing in growth and could profitably spend more to acquire customers faster.
CAC payback period is the second, more cash-focused judgement. It is CAC divided by the monthly gross profit a customer produces, and it answers the question every founder watching a bank balance cares about: how many months until a new customer has paid back what it cost to acquire them? A payback period under twelve months is generally considered healthy for business-to-business SaaS, because it means the cash you spend on growth returns within a year and can be recycled into acquiring the next customer. A long payback period ties up cash and makes fast growth expensive to finance, even when the longer-run LTV to CAC ratio looks fine.
| Unit-economics metric | Formula | Healthy benchmark |
|---|---|---|
| ARPA | Ending MRR / number of customers | Context-dependent |
| LTV | ARPA x gross margin x (1 / churn) | Higher is better |
| CAC | Sales & marketing spend / new customers | Lower is better |
| LTV : CAC | LTV / CAC | 3 : 1 or higher |
| CAC payback | CAC / (ARPA x gross margin) | Under 12 months |
Quick ratio
The SaaS quick ratio is a fast, elegant measure of growth efficiency. It is the revenue you added, new plus expansion MRR, divided by the revenue you lost, contraction plus churn MRR. A quick ratio of 4 means that for every dollar of recurring revenue you lost, you added four, a strong, efficient growth profile. A quick ratio of 1 means you are exactly treading water, adding as much as you lose, and anything below 1 means the business is shrinking despite its sales efforts. The quick ratio is useful precisely because it compresses the whole four-way movement of MRR into a single number that instantly signals whether growth is comfortably outrunning churn or barely keeping pace with it.
The Rule of 40
The Rule of 40 is a simple check on the balance between growth and profitability, and it becomes more relevant as a company matures. It states that a healthy SaaS company's growth rate plus its profit margin should add up to at least 40. A company growing 30 percent a year with a 10 percent operating margin scores 40 and passes; so does a company growing 50 percent while burning at a 10 percent loss margin, because rapid growth can justify short-term losses. The rule captures a real trade-off: early on, it is rational to sacrifice profit for growth, but as growth naturally slows, profitability must rise to compensate. A company that is neither growing fast nor profitable, and so scores well under 40, is usually the one to worry about.
How the metrics fit together
None of these metrics means much in isolation, and the real skill is reading them as a connected system. Churn sets the average customer lifetime, lifetime drives LTV, and LTV weighed against CAC decides whether acquisition is profitable, which in turn determines how aggressively you can afford to grow. Retention, expressed as NRR, decides whether that growth compounds on top of a solid base or is forever refilling a leaking bucket. The Rule of 40 then sits on top as a sanity check that growth and profitability are in a sensible balance for the company's stage. A change in one metric ripples through all the others: reduce churn, and lifetime, LTV, the LTV to CAC ratio and NRR all improve at once. That interconnection is why a single dashboard that shows every metric together, each against its benchmark, is so much more useful than any one figure on its own.
Benchmarks by company stage
Benchmarks are not one-size-fits-all, and applying a mature company's standards to an early-stage startup is a common mistake. A seed-stage company still searching for product-market fit is reasonably held to a gentler bar on churn and payback, because its priority is learning and growth, not efficiency. A mature, profitable company is expected to have low churn, expansion-led retention and clear profitability. The table below gives rough, stage-adjusted guide rails; treat them as starting points to argue with, not laws.
| Stage | Monthly churn | NRR | LTV:CAC | CAC payback |
|---|---|---|---|---|
| Seed / pre-PMF | Under 5% | 90%+ | 2:1+ | Under 18 months |
| Series A / early growth | Under 4% | 100%+ | 3:1+ | Under 15 months |
| Growth / scaleup | Under 2.5% | 105%+ | 3:1+ | Under 12 months |
| Mature / profitable | Under 1.5% | 110%+ | 3:1+ | Under 12 months |
Common mistakes when tracking SaaS metrics
Even experienced operators trip over the same handful of errors. Being aware of them is half the battle:
- Counting a full annual payment as one month of MRR, instead of spreading it across the twelve months it covers.
- Confusing revenue churn with customer churn, and missing that a few large accounts leaving can dwarf many small ones.
- Reading new MRR in isolation and ignoring what was lost to contraction and churn in the same month.
- Calculating a percentage change against the wrong base, a classic arithmetic slip covered by the percentage calculator.
- Using LTV figures that ignore gross margin, which overstates the true profit a customer produces.
- Judging CAC without pairing it against LTV and payback, so a low CAC on churn-prone customers looks better than it is.
- Applying late-stage benchmarks to an early-stage company, and panicking over numbers that are perfectly normal for the stage.
Most of these mistakes share a root cause: looking at one metric without the context of the others. The antidote is to compute the full set together, from the same underlying figures, so that the relationships are visible and the traps are hard to fall into.
Enter one month of revenue and customer movement and get a full professional report: every metric with its formula and benchmark, five charts, a health score, stage presets and a one-click PDF, all computed privately in your browser.
Putting it into practice
The most valuable way to use these metrics is not to calculate them once but to track them every month and watch the direction of travel. A single month's snapshot tells you where you stand; a run of months tells you whether you are getting better or worse, which is what actually matters. Pick a consistent method for splitting your MRR into its four movements, compute the full set of metrics from the same figures each month, and compare against both your own prior months and the stage-appropriate benchmarks. The trend in net new MRR, NRR and the LTV to CAC ratio, in particular, will tell you early whether the business is compounding or quietly stalling, long before it shows up in the bank balance.
You do not need a finance team or an expensive analytics platform to do this well. The arithmetic is entirely within reach of anyone who understands the definitions in this guide, and the free SaaS Metrics Analyzer handles the whole calculation in seconds, shows each result against its benchmark, and even tells you the specific change in churn, CAC or expansion needed to hit each target. Because it runs entirely in your browser, you can safely enter real company figures; nothing is uploaded. Learn the definitions, watch the trend, and read the metrics as the connected system they are, and you will understand your SaaS business more clearly than most of the people running one.